Welcome to the NYSARH Diversity Dashboard! This dashboard was created by NYSARH and Common Ground Health to provide valuable demographic information for stakeholders in New York’s rural communities. It serves as a resource for activities like grant writing and population health planning. The data used in this dashboard is sourced from the US Census Bureau’s American Community Survey (ACS), which provides essential information about our nation and its people on a yearly basis.
In this FAQ, we will guide you through the dashboard’s main features and help you navigate its pages effectively.
- DP03 – Selected Economic Characteristics
- DP04 – Selected Housing Characteristics
- DP05 – Selected Demographic and Housing Estimates
- S1501 – Educational Attainment
- S1701 – Poverty Status in the last 12 Months
- S1810 – Disability Characteristics
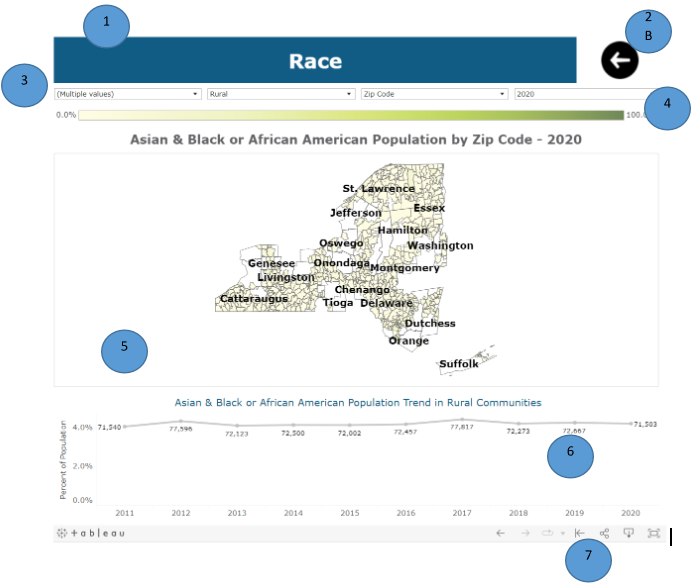
Page Title: This provides a broad description of the content displayed on the page.
Back Button: Clicking this button allows you to return to the data source landing page.
Filter bar: Depending on the data source and topic, you will find various filters that allow you to customize the information displayed on the page. The following filters are available on each page:
Rural/Urban/All: The default selection is rural communities (zip/census tracts with a RUCA code 4 or higher). You can also choose to view urban communities or all zip/census tracts in NYS.
Geography: This filter allows you to switch between viewing data by zip codes or census tracts.
Year: You can change the year of the data you want to view on the map. The default is the most recent year (2021 in most cases).
Additionally, topic-specific filters will be included for further customization. In the example shown, there is a multi-select filter to choose the race for which you want information. More information on how these multi-select filters work will be provided later in this document.
Color Legend: This shows the range of the main metric represented on the map. For most maps, it displays the percentage of the population that meets the selected filter criteria. However, for measures like income, it shows the estimate.
Map: The map displays the percentage of the population that meets the selected filter criteria. Hovering over different areas of the map will trigger a tooltip, providing more detailed information about that specific geography (e.g., zip code/census tract, county, population numerator, and total population denominator). The map also functions as a filter for the trend chart below. Clicking on specific zip codes/census tracts will filter the chart to display data for that specific geography. The map’s title provides a detailed view of the data you are viewing.
Trend Chart: This line graph shows the percentage of the population meeting the filter criteria for all of NYS by default. When you click on a zip code/census tract on the map, the chart updates to show data only for that geography. The numbers displayed on the chart represent the population numerator. The tooltip provides detailed information similar to the map tooltip.
Toolbar: This toolbar allows you to interact with the dashboard, including downloading the image or data behind the image. When downloading data, your current filter selections, including geography filters from the map, will be maintained, ensuring that only the selected data is downloaded.
Diversity Dashboard Overview
This section provides an overview of the different tables and data sources included in the dashboard. There are two main types of sources: Data Profiles (DP) and Subject Tables (S).
Data Profiles (DP) contain frequently requested social, economic, housing, and demographic data. Subject Tables (S) provide pretabulated estimates and percentages for various topics, often categorized by age, sex, or race/ethnicity.
The following pages provide an overview of each data source and its corresponding table. For more detailed information on specific topics and filter metrics, please refer to the ACS 2021 Subject Definition PDF
DP03 – Selected Economic Characteristics
DP03 collects information on various economic characteristics. It includes 8 topic areas, each represented by a dedicated page in the dashboard. Here are the names of the topic pages and the specific filters available on each page:
Class of Worker: This page displays the population working in different sectors in a geography, such as government, private company, self-employed, or unpaid family worker. There is one multi-select filter available to choose from the listed options.
Method of Commuting to Work: This page displays how workers in a geography transport themselves to work. There is one multi-select filter available for selecting different transportation types and the option to work from home.
Employment Status: This page displays the employment status of the population aged 16 years and older in a geography. There is a multi-select filter for selecting employment status and a single select filter for choosing the total population aged 16 and older or females aged 16 and older. Users should be advised to unselect the employment status filter before changing the population filter (population/female) to ensure appropriate options are available.
Health Insurance Coverage: This page displays the health insurance coverage of the population in a geography, categorized by employment status and age. There are multi-select filters for selecting employment status and age, and a single select filter for choosing health insurance coverage. Users should be advised that information on uninsured persons is available only for those under 18/19 years old (the age may vary by year).
Income Level of Families & Households: This page displays the income level of families and the income level/sources of other income for households. There is a multi-select filter for selecting the income level/sources of other income, and a single select filter for choosing families or households. Users should be advised to clear the income filter before changing the households/families filter to ensure appropriate options are available.
Mean/Median Income of Families & Households: This page displays the mean and median income and earnings for families, households, and male/female workers. There are two single select filters: one for selecting mean/median income/earnings and another for choosing families or households. Users should be advised that switching between families and households requires setting the income filter to null. Additionally, trend data is only available for unique geographies and cannot be aggregated like other measures due to the nature of the values.
Industry Employed In: This page displays the type of industry in which the civilian population aged 16 years and older are employed in a geography. There is one multi-select filter for selecting the type of industry.
Occupation: This page displays the occupation of the population aged 16 years and over in a geography. There is one multi-select filter for selecting the occupation.
DP04 – Selected Housing Characteristics
DP04 collects information on various housing characteristics. It includes 12 topic areas, each represented by a dedicated page in the dashboard. Here are the names of the topic pages and the specific filters available on each page:
Bedrooms/Rooms: This page displays the number of bedrooms/rooms per housing unit in a geography. There is one multi-select filter available for selecting the number of bedrooms/rooms. Users should be advised not to select both the number of bedrooms and rooms to avoid double counting.
Gross Rent & Percentage of Income: This page displays the dollar cost or percentage of income that renters pay for their housing in a geography. There is one multi-select filter available for selecting the dollar cost or percentage of income for renters. Users should be advised not to select both the dollar cost and percentage of income to avoid double counting.
Selected Monthly Owner Costs & Percentage of Income: This page displays the dollar cost or percentage of income that homeowners pay for their housing in a geography. There is one multi-select filter available for selecting the dollar cost or percentage of income for homeowners. Users should be advised not to select both the dollar cost and percentage of income to avoid double counting.
Home Heating Fuel & Selected Characteristics: This page displays the type of home heating fuel used and other housing characteristics (e.g., lack of plumbing, phone, etc.) in a geography. There is one multi-select filter available for selecting the home heating fuel and other characteristics. Users should be advised not to select both the home heating fuel and other characteristics to avoid double counting.
Occupancy: This page displays the occupancy status of housing units in a geography. There is a single select filter available for choosing between vacant or occupied housing units.
Housing Tenure & Year Owner Moved: This page displays the tenure of a housing unit (renter or owner occupied) and the year the owner moved into owner-occupied units in a geography. There is one multi-select filter available for selecting the tenure and year the owner moved into the unit. Users should be advised not to select both tenure and a specific time frame to avoid double counting.
Mortgage Status: This page displays the mortgage status of owner-occupied units in a geography. There is one single select filter available for selecting the mortgage status.
Occupants per Room: This page displays the ratio of occupants per room for occupied housing units in a geography. There is a multi-select filter available for selecting the number of occupants per room.
Units in Structure: This page displays the number of units in total housing units in a geography. There is one multi-select filter available for selecting the number of units.
Value of Owner-Occupied Units: This page displays the value of owner-occupied units in a geography. There is one multi-select filter available for selecting the value of the unit.
Vehicles Available: This page displays the number of vehicles available in occupied housing units in a geography. There is one multi-select filter available for selecting the number of vehicles available.
Year Structure Built: This page displays the year range in which structures were built for all units in a geography. There is one multi-select filter available for selecting the year range of structure construction.
DP05 – Selected Demographic and Housing Estimates
DP05 provides demographic and housing estimates and consists of 6 topic areas, each represented by a dedicated page in the dashboard. Here are the names of the topic pages and the specific filters available on each page:
Race: This page displays the population of a geography based on the primary race selected by respondents. There is one multi-select filter available for selecting race. Users should exercise caution when selecting subgroups of certain racial groups (e.g., tribal affiliation for indigenous peoples or county of origin for Asian peoples) as it may result in double counting if selected alongside the main group (e.g., AIAN or Asian).
Race/Ethnicity: This page displays the population of a geography based on the primary race/ethnicity selected by respondents. There is one multi-select filter available for selecting race/ethnicity. Users should exercise caution when selecting both the Latino subgroups and the main group, as it may lead to double counting.
Race Alone or in Combination: This page displays the population of a geography based on any race selected by respondents. There is one multi-select filter available for selecting race. It’s important to note that on this page, individuals who identify as multiracial are intentionally double-counted and placed in all the races they identify with on their survey, as per the design of the ACS.
Sex & Age: This page displays the population of a geography based on the age and sex selected by respondents. There are filters available for both age and sex. There is one multi-select filter for age and one single select filter for sex. Users should be aware that only certain age groups can be filtered by sex, which may result in no data appearing if a sex is selected for smaller age group segments.
Citizen Voting Age Population (18+ Population): This page displays the population of a geography based on the sex selected by respondents who are 18 years and older. There is one single select filter available for selecting sex.
Total Housing Units: This page displays the total number of housing units in a geography. There are no additional filters available on this page.
S1501 – Educational Attainment
S1501 provides information on educational attainment for different demographic groups, including age, sex, and race/ethnicity, as well as median income and poverty rate for groups with varying educational attainment. It consists of 6 topic areas, each represented by a dedicated page in the dashboard. Here are the names of the topic pages and the specific filters available on each page:
Educational Attainment for the Population 18 to 24 years: This page displays the highest level of education reached by the population aged 18 to 24 in a geography. There is one multi-select filter available for selecting educational attainment and a single select filter for sex.
Educational Attainment for the Population 25 years and older: This page displays the highest level of education reached by the population aged 25 years and older in a geography. There is one multi-select filter available for selecting educational attainment and a single select filter for sex.
Educational Attainment by Age: This page displays the highest level of education reached by different age groups in a geography. There is one multi-select filter available for selecting age and a single select filter for educational attainment.
Educational Attainment by Race/Ethnicity: This page displays the highest level of education reached by different race/ethnicity populations in a geography. There is one multi-select filter available for selecting race/ethnicity and a single select filter for educational attainment.
Median Income by Educational Attainment: This page displays the median income by educational attainment and sex for a geography. There is a single select filter available for selecting educational attainment and sex. Users should be advised that trend data is only available for unique geographies and cannot be aggregated like other measures due to the nature of the values.
Poverty Rate by Educational Attainment: This page displays the poverty rate by educational attainment and sex for a geography. There is a single select filter available for selecting educational attainment and sex. Users should be advised that trend data is only available for unique geographies and cannot be calculated, as the ACS only provides rates, not estimates of the population in poverty in S1501.
S1701 – Poverty Status in the last 12 Months
S1701 provides information on poverty status for different demographic groups, including age, sex, race/ethnicity, and educational attainment. It consists of 8 topic areas, each represented by a dedicated page in the dashboard. Here are the names of the topic pages and the specific filters available on each page:
Poverty Rate by Work Experience: This page displays the poverty rate of a geography based on the past year work experience of residents (did not work, part-time, full-time). There is one multi-select filter available for selecting work experience.
Poverty Rate by Age: This page displays the poverty rate of a geography based on age. There is one multi-select filter available for selecting age.
Poverty Rate for Unrelated Individuals: This page displays the poverty rate for unrelated individuals in a geography. There are three multi-select filters available: one for work experience, one for sex, and one for age. Users should be advised that the age filter (3rd from the left in the filter bar) needs to be set to null in order to use the other filters.
Poverty Rate by Race/Ethnicity: This page displays the poverty rate by race/ethnicity for a geography. There is one multi-select filter available for selecting race/ethnicity. Users should be advised that selecting both “White alone” and “White alone, not Hispanic or Latino” will result in double counting.
Poverty Rate: This page displays the overall poverty rate of a geography. There are no additional filters available.
Poverty Rate by Sex: This page displays the poverty rate of a geography based on sex. There is one single select filter available for selecting sex.
S1810 – Disability Characteristics
S1810 provides information on disability status by age, sex, and race/ethnicity. It consists of 4 topic areas, each represented by a dedicated page in the dashboard. Here are the names of the topic pages and the specific filters available on each page:
Disability Status by Age: This page displays the population with disabilities in different age groups for a geography. There is one multi-select filter available for selecting the age group.
Disability Type by Age: This page displays the type of disability for different age groups in a geography. There are multi-select filters available for selecting disability type and age group. Users should be advised that not all disability types are available for all age groups.
Disability Status by Race/Ethnicity: This page displays the disability status of race/ethnicity populations in a geography. There is a multi-select filter available for selecting race/ethnicity. Users should be advised that selecting both “White alone” and “White alone, not Hispanic or Latino” will result in double counting.
DP02 – Selected Social Characteristics
DP02 collects information on various social characteristics. It includes 14 topic areas, each represented by a dedicated page in the dashboard. Here are the names of the topic pages and the specific filters available on each page:
Ancestry: This page displays the ancestry of the population in a given geography. There is one multi-select filter available for selecting ancestry.
Computers and Internet: This page displays the presence of computers or broadband internet in households within a geography. There is one single select filter for choosing computer or broadband internet.
Disability or Veteran Status: This page displays the population with disabilities or those who are civilian veterans in a geography. There is one single select filter for disability or veteran status, and one multi-select filter for age. Please note that the age group for veteran status is 18 years and older.
Educational Attainment: This page displays the educational attainment of the population aged 25 years and older in a geography. There is one multi-select filter for selecting educational attainment. Users should be aware that when selecting “High School Graduate or Higher” or “Bachelor’s Degree or Higher,” they should not select any higher education levels to avoid double counting.
Marital Status of Women who have given birth in the past 12 months: This page displays the population of unmarried women aged 15-50 who have given birth in the past year in a geography. There are no additional filters for this page.
Grandparents who live with their grandchildren: This page displays the population of grandparents who live with their grandchildren in a geography. There is a multi-select filter for selecting grandparents who are responsible for their grandchildren and different age groups of those children. There is also a single select filter for the sex of the grandparent.
Households by Type: This page displays the type of households (householder living alone, family, married, etc.) in a geography. There is one multi-select filter for selecting household type, which includes subgroups of household type with children. Users should not select both household options (e.g., married and married with children) to avoid double counting. There is also a single select filter for age to be used when selecting the householder living alone option. Lastly, there is another multi-select filter for sex to be used for the “no spouse” option.
Language Spoken at Home: This page displays the language spoken at home in a geography. There is a multi-select filter for selecting the language and a single select filter for English proficiency to be used when selecting languages other than English.
Marital Status: This page displays the marital status in a geography. There is a multi-select filter for selecting marital status and a single select filter for sex. Users should be advised that selecting “null” in the marital status filter will give them the entire population of the geography.
Relationship to head of household: This page displays the relationship to the head of household in a geography. There is one multi-select filter for selecting the relationship to the head of household.
Residence 1 Year Ago: This page displays the previous residence of the population in a geography. There is one multi-select filter for selecting the previous residence. Users should not select different house subgroups (e.g., same state, different state) to avoid double counting.
School Enrollment: This page displays the level of school enrollment for individuals aged 3 years and older in a geography. There is one multi-select filter for selecting the level of school.
Foreign Born Population: This page shows the year of entry, citizenship status, or world region of birth for the foreign-born population in a geography. There is a single select filter for choosing the year of entry, citizenship status, or world region of birth. There is also a multi-select